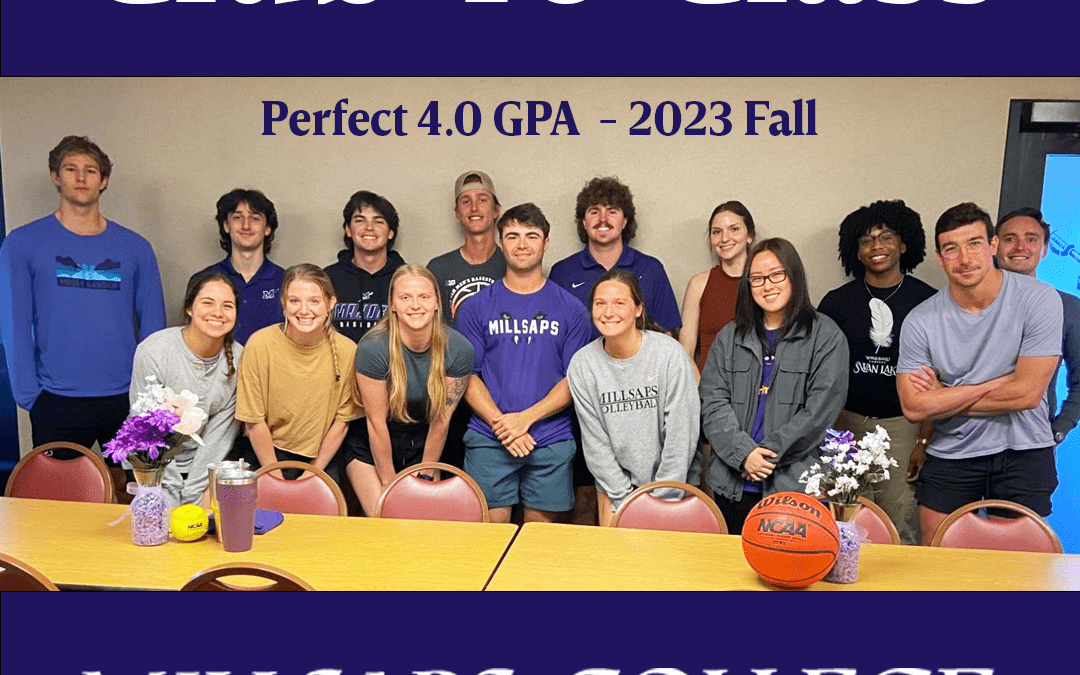
Photo: The Fourth Night Ceremony celebrates the arrival of the new student scholars to the Millsaps community. On the fourth night of the students’ tenure at the College they pledge to uphold the Student Conduct Code and are challenged to uphold the high standards adhered to by Millsaps.
Consistent with the College’s mission statement, which is informed by the College’s vision to engage “… students in a transformative learning and leadership experience that results in personal and intellectual growth….”, Millsaps College measures the achievement of its students using a variety of methods, and continually evaluates the results to ensure student success.
To that end, Millsaps College has identified retention rates, graduation rates, and satisfactory academic progress towards academic program completion as measures of student achievement that are consistent with the College’s mission of academic excellence for undergraduate and graduate students. The College has identified those metrics because they represent different outcomes related to successful students:
- Retention Rates: For a student be successful, the student must remain enrolled. Retention rates provide a quantifiable measure of student persistence.
- Graduation Rates: The ultimate goal for all students, both graduate and undergraduate, is to successfully complete their college experience with a credential. Graduation rates provide a quantifiable measure of student completion. Because most students who will complete do so within six years, the six year IPEDS graduation rate is used as the completion metric.
- Satisfactory Academic Progress: Whereas retention rates provide an opportunity to monitor persistence and graduation rates provide an opportunity to monitor successful completion, satisfactory academic progress provides an opportunity to quantifiably monitor the quality of the student’s progression towards a degree. Satisfactory Academic Progress provides three data points to monitor student progress toward satisfactorily completing their academic program: maintaining a minimally acceptable grade point average, attempting the minimally required number of credits each year, and completes within a reasonable time period.
Retention Rates
Throughout our admissions process we work hard to understand a prospective student’s academic performance to gauge their ability to perform well within the academic program at Millsaps. To assist students during their tenure at Millsaps, we provide deliberate and consistent academic support and advising services, including an early identification and response system for those who might be struggling in the classroom.
Additionally, while realizing that the academic experience is a primary driver, we understand that it is important for students to thrive both inside and outside the classroom. To that end, the College has a variety of programming for the student life experience outside of the classroom. A student who performs well inside the classroom and has an enjoyable experience outside of the classroom is most likely to continue their academic pursuits. We encourage participation in extracurricular activities so as to build connections and support across campus. Every four years, we conduct a quality of life survey to garner levels of student satisfaction and identify improvements that can be made to enhance this area of student life.
The related measure of success and student achievement is first-year retention (the number of students who successfully complete their first year and return to Millsaps for their sophomore year) for undergraduate students. Our goal is that 80% of freshmen return in their sophomore year. Once the College has reached a consistent 80% retention rate, the goal will be moved to 85% retention of first-year students.
Retention of graduate students is analyzed a little differently because graduate students tend to start at different points within the academic year. As a result, retention for graduate students is based on all graduate students enrolled in the fall rather than focusing on graduate students who begin in the fall. Graduate student retention rates are typically higher for graduate students, and the graduate student retention goal is higher to reflect the higher rates. Our goal is that 90% if graduate students return the following year, if they do not graduate prior to the following year.
Fall-to-Fall Retention Rate Trends | ||||||
---|---|---|---|---|---|---|
Fall 2014
to Fall 2015 |
Fall 2015
to Fall 2016 |
Fall 2016
to Fall 2017 |
Fall 2017
to Fall 2018 |
Fall 2018
to Fall 2019 |
Five-Year
Average of Averages |
|
Undergraduate | 79.2% | 81.2% | 74.9% | 78.6% | 75.0% | 77.8% |
Graduate | 93.2% | 100.0% | 96.9% | 92.3% | 93.9% | 95.3% |
Graduation Rates
The federal government requires institutions of higher education to report their six-year graduation rate as another metric of student achievement. There are multiple measures of graduation rates available, and Millsaps has chosen to use the Integrated Postsecondary Education Data System (IPEDS) calculation. This calculation captures the percentage of a first year class, or cohort, who start with an institution as first-time first-year students and who remain with that institution and receive their degree within a six-year time frame. Our goal is that 70% of our undergraduate students graduate within six years. Our annual average for the last five years (through May of 2020) is 68.1%. Although the six-year graduation rates of the last two cohorts have been higher than the prior two cohorts, this is below our goal of 70% and the focus of significant rebuilding to drive necessary improvements on behalf of our students.
Because graduate students don’t necessarily start in the fall semester, all students starting within an academic year are considered as a single cohort when calculating graduate student six-year graduation rates. Our goal is that 85% of our graduate students will complete their program and graduate.
Six-Year Graduation Rate Trends | ||||||
---|---|---|---|---|---|---|
Cohort | ||||||
Fall 2010 | Fall 2011 | Fall 2012 | Fall 2013 | Fall 2014 | Five Year
Average of Averages |
|
Undergraduate | 71.6% | 66.5% | 63.8% | 70.8% | 67.8% | 68.1% |
Graduate | 90.5% | 80.0% | 87.2% | 93.8% | 90.6% | 88.4% |
Satisfactory Academic Progress
Satisfactory Academic Progress is measured in accordance with programs of federal financial assistance. Federal law mandates that those students receiving this assistance progress satisfactorily toward completion of their course of study. Satisfactory academic progress is measured in three ways—(1) students must progress qualitatively by earning a minimum grade point average (from 1.5 to 2.0); (2) students must progress quantitatively by completing the required minimum number of credits each year; and (3) students must complete their program of study within a reasonable time period. Our goal is that 93% of undergraduate students and 95% of our graduate students demonstrate satisfactory academic progress.
Satisfactory Academic Progress Trends | ||||||
---|---|---|---|---|---|---|
2016-2017 | 2017-2018 | 2018-2019 | 2019-2020 | 2020-2021 | Five-Year
Average of Averages |
|
Undergraduate | 93.0% | 94.9% | 94.9% | 96.8% | 93.0% | 94.4% |
Graduate | 96.0% | 98.8% | 100.0% | 98.5% | 100.0% | 98.7% |